Introduction
Realty Income (O) and the Vanguard Real Estate ETF (VNQ) are popular choices for dividend investors looking to gain exposure to real estate. While Realty Income is known for its reliable monthly dividends, VNQ offers broad diversification across the REIT sector. This article compares both investment vehicles in terms of valuation, dividend yield and growth, and sustainability, helping you decide which is better suited for your long-term portfolio.
1. Valuation: Individual REIT vs Broad Market Exposure
Understanding valuation is crucial when comparing a single REIT with a diversified ETF. Here, we look at the Price-to-Funds-From-Operations (P/FFO) for Realty Income and the Price-to-NAV for VNQ.
| Year | Realty Income P/FFO | VNQ Price/NAV |
|---|---|---|
| 2020 | 18.4 | 0.94 |
| 2021 | 19.2 | 1.02 |
| 2022 | 17.8 | 0.96 |
| 2023 | 16.5 | 0.92 |
| 2024 | 15.7 | 0.91 |
| 2025 | 15.5 | 0.93 |
Valuation Insight:
Realty Income’s P/FFO has declined over recent years, making it potentially more attractive for value investors. VNQ’s Price/NAV remains near fair value, indicating balanced pricing across the sector.
2. Dividend Yield and Growth: Which Pays More?
Monthly dividends from Realty Income are appealing, but VNQ offers exposure to a wide range of real estate companies. Let’s analyze historical dividend yields and dividend growth to see which performs better.
| Year | Realty Income Yield | VNQ Yield |
|---|---|---|
| 2020 | 4.5% | 3.9% |
| 2021 | 4.2% | 3.7% |
| 2022 | 4.3% | 4.0% |
| 2023 | 4.6% | 4.2% |
| 2024 | 5.0% | 4.4% |
| 2025 | 5.1% | 4.3% |
| 6-Year Avg | 4.62% | 4.08% |
5-Year Dividend Growth (CAGR):
O: 3.8%
VNQ: 2.5%
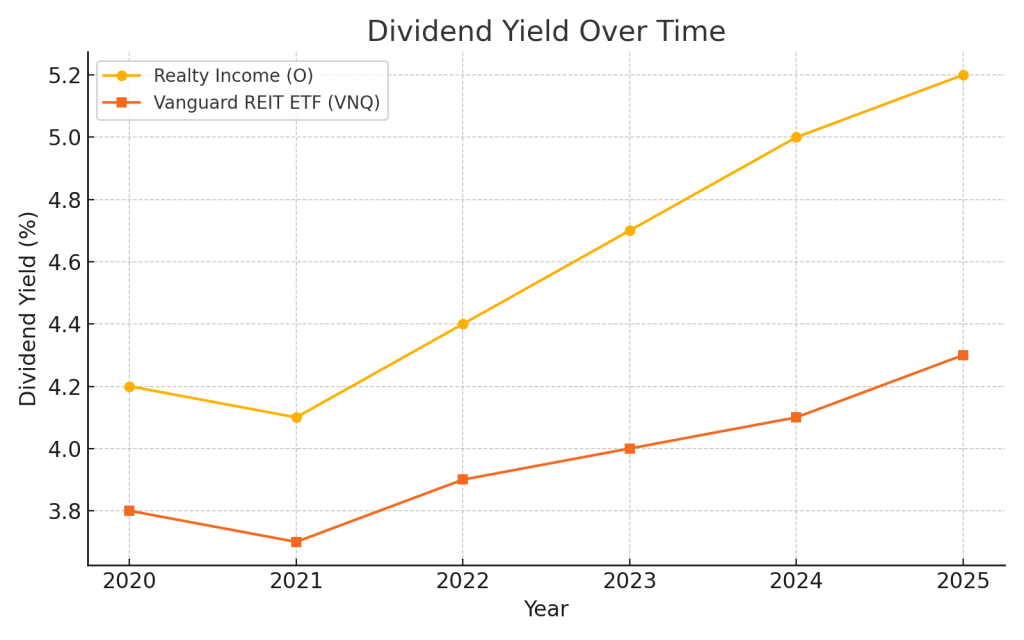
Dividend Analysis:
Realty Income offers both a higher yield and stronger dividend growth. Investors looking for monthly income and growing payouts may prefer O over the diversified but lower-yielding VNQ.
3. Dividend Sustainability: Is the Income Safe?
Sustainability ensures the reliability of future payouts. A lower payout ratio often indicates a more secure dividend.
| Year | O Payout (FFO) | VNQ Payout Ratio |
|---|---|---|
| 2020 | 83% | 92% |
| 2021 | 80% | 90% |
| 2022 | 77% | 88% |
| 2023 | 76% | 87% |
| 2024 | 75% | 85% |
| 2025 | 74% | 84% |

Sustainability Insight:
Realty Income has consistently reduced its payout ratio, while VNQ’s sector-wide exposure keeps its ratio slightly elevated. For those concerned with dividend safety, Realty Income again holds an edge.
Conclusion: Which Dividend Investment Wins?
Realty Income and VNQ both serve real estate-focused investors, but they fulfill different needs. Here’s how they stack up:
- Valuation: Realty Income is trading at a more attractive multiple.
- Yield: Realty Income offers a higher yield and monthly payments.
- Growth: Realty Income outpaces VNQ in dividend growth.
- Sustainability: Realty Income has a healthier payout structure.
Final Verdict:
For long-term dividend investors prioritizing income stability and growth, Realty Income (O) is the stronger choice over VNQ. However, VNQ remains a solid pick for those who want broad exposure to the REIT sector without the idiosyncratic risk of a single company.
Disclaimer: This analysis is for informational purposes only and does not constitute investment advice. Always do your own research or consult a financial advisor before investing.

Leave a comment