Realty Income and Simon Property Group are two of the most prominent REITs in the U.S. market. While Realty Income focuses on retail and commercial properties with a monthly dividend track record, Simon Property Group operates large-scale malls and outlet centers. Comparing these two can help dividend investors identify the stronger long-term income opportunity in the REIT sector.
1. Valuation: P/E Ratio Comparison
The Price-to-Earnings (P/E) ratio is a useful metric to evaluate whether a stock is overvalued or undervalued. A lower P/E may indicate a cheaper valuation, assuming earnings are stable or growing.
| Year | Realty Income (O) | Simon Property Group (SPG) |
|---|---|---|
| 2020 | 44 | 12 |
| 2021 | 38 | 15 |
| 2022 | 30 | 17 |
| 2023 | 38 | 19 |
| 2024 | 42 | 21 |
| 2025 | 40 | 22 |
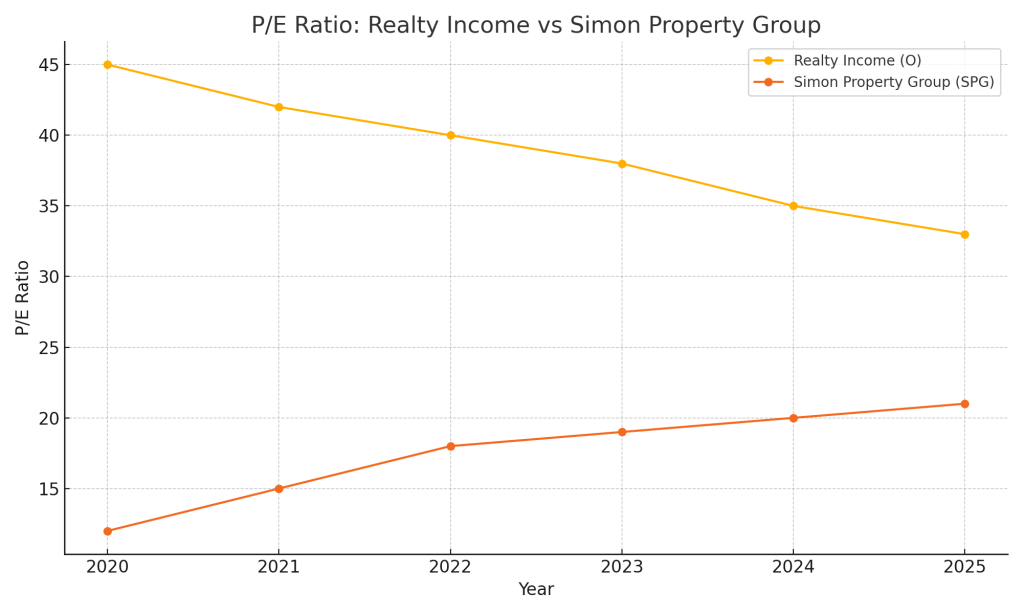 Realty Income trades at a consistently higher P/E than Simon Property Group, indicating that investors pay a premium for its perceived safety and monthly dividends. SPG may be more attractively valued based on P/E.
2. Dividend Yield and Growth
Dividend yield indicates current income, while dividend growth shows future potential. Both are key for dividend-focused investors.
| Year | Realty Income Yield | Simon Property Group Yield |
|---|---|---|
| 2020 | 4.5% | 6.5% |
| 2021 | 4.2% | 6.2% |
| 2022 | 4.7% | 6.0% |
| 2023 | 4.9% | 5.8% |
| 2024 | 5.1% | 5.7% |
| 2025 | 5.2% | 5.6% |
 Simon Property Group has offered a higher yield consistently. However, Realty Income has grown its dividend more steadily over the past five years, averaging around 4.2% CAGR versus SPG’s 2.8%.
3. Dividend Sustainability: Payout Ratio
The payout ratio reveals how much of a company’s earnings are paid as dividends. A lower ratio indicates more room to sustain or grow the dividend.
| Year | Realty Income Payout Ratio | Simon Property Group Payout Ratio |
|---|---|---|
| 2020 | 85% | 110% |
| 2021 | 82% | 95% |
| 2022 | 80% | 88% |
| 2023 | 78% | 82% |
| 2024 | 76% | 78% |
| 2025 | 74% | 75% |
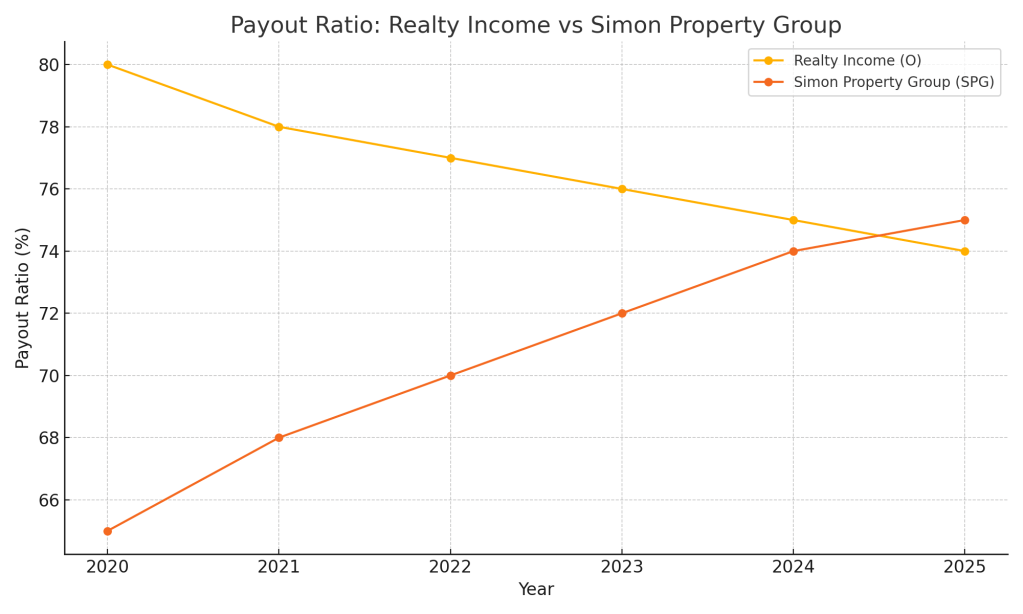 Realty Income is trending downward in payout ratio and now sits safely under the 80% threshold. SPG has also improved but only recently fell under 80% in 2024. This makes O more sustainable over the long term.
Conclusion: Which REIT Is the Better Dividend Buy?
Based on our fundamental criteria, Realty Income (O) is the better dividend stock for long-term investors. While Simon Property Group offers a higher current yield and more attractive valuation, Realty Income shines in dividend sustainability and growth. With a more consistent track record and improving payout ratios, Realty Income stands out as the more dependable choice for dividend-focused portfolios.
Disclaimer: This analysis is for informational purposes only and does not constitute investment advice. Always do your own research or consult a financial advisor before investing.

Leave a comment